Arts & Culture
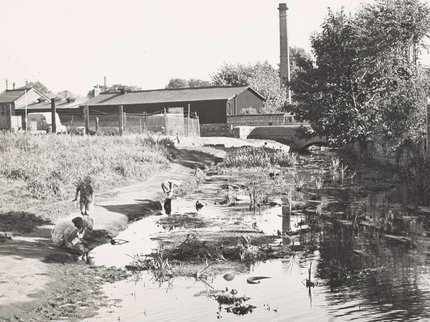
The Leen: Nottingham's River Exhibition
From its source in the Robin Hood Hills above Newstead Abbey to the River Trent at the Meadows, the…
Did you know ? We've been bringing you culture, learning and libraries since 2016. Find out more about 10 years of Inspire.
Inspire is committed to being a diverse and inclusive employer, and see the publishing of Gender Pay Gap data as a positive step in talking about gender equality. We have a largely female workforce, with females making up 76.5% of our staff. The information below shows our gender pay gap, as required by legislation, looking at mean average (adding up all of the numbers and dividing the result by how many numbers were in the list) and median average (listing all of the numbers in numerical order and finding the number in the middle). The data is a snapshot of the difference between the average hourly pay levels of all women compared to all men who are employees of Inspire, expressed as a percentage of men’s average pay. Also displayed are the pay quartiles, which show the gender distribution across Inspire in four equally sized hourly pay segments.
The gender pay gap is different from equal pay, which is concerned with ensuring that men and women are paid the same for carrying out the same work, or work of equal value. All of our jobs are evaluated externally by an independent job evaluation assessor, to ensure that we uphold equal pay.
Our data indicates that the gender pay gap is due to proportionately more men being in senior and professional roles, which attract a higher level of pay, whilst proportionately more females are in our part-time, customer service and support roles.
We are continuing to work with colleagues to look at how we can ensure that all staff, regardless of gender, can fulfil their potential within Inspire.
I certify that the information contained in this report is accurate.
Peter Gaw
Chief Executive Officer
Culture, Learning and Libraries (Midlands) – InspireDirectly Employed Headcount in scope: 616
Female: 76.5%
Male: 23.5%
| Lower quartile % | Second quartile % | Third Quartile % | Upper Quartile % | ||||
|---|---|---|---|---|---|---|---|
| Male | Female | Male | Female | Male | Female | Male | Female |
| 20 | 80 | 22 | 78 | 26 | 74 | 32 | 68 |
Arts & Culture
From its source in the Robin Hood Hills above Newstead Abbey to the River Trent at the Meadows, the…

Arts & Culture
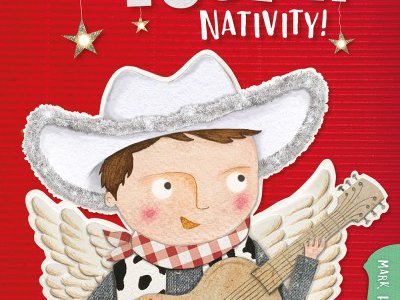
Services for Schools
We have an unbeatable FREE nativity offer for schools this autumn .... learn more here.
By becoming a library member you will be able to borrow books and items for FREE in libraries across the county, including mobiles. You can also access eResources, Ancestry and more!
Not a member yet? Join us - become a library member